
If you have ever opened the Unity Profiler and wondered why there is a Render Thread separate from the Main Thread, you are asking the right question.
Understanding the Render Thread is critical for diagnosing CPU vs GPU bottlenecks and for making sense of Gfx.* markers in the profiler.
This is not an abstract concept. If you misinterpret what the Render Thread does, you will optimize the wrong part of your game.
The Render Thread’s Core Responsibility
The Render Thread acts as the bridge between game logic and the GPU.
In simple terms:
- Main Thread decides what should be rendered
- Render Thread prepares and submits how it will be rendered
- GPU executes the rendering work
The Render Thread does not render pixels itself. Instead, it:
- Records draw commands
- Binds textures, buffers, and render states
- Submits commands to the graphics API (DirectX, Vulkan, Metal, etc.)
This separation allows Unity to overlap gameplay work with rendering preparation.
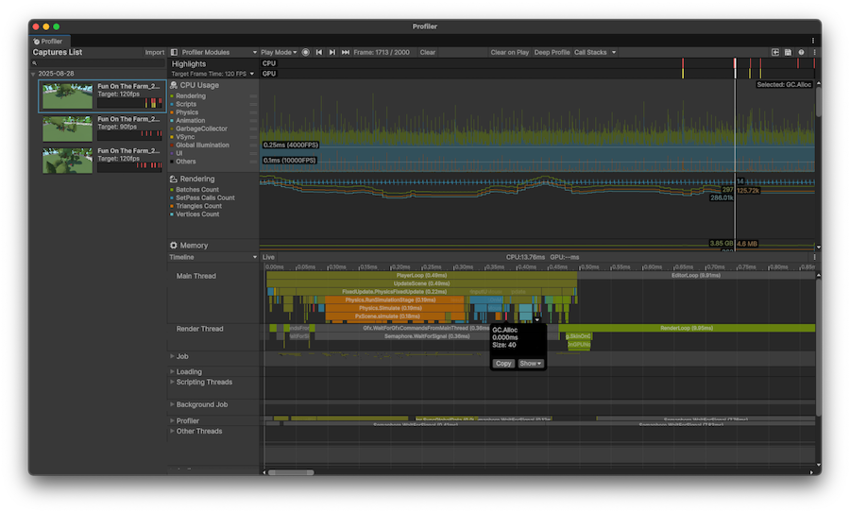
Render Thread Markers in the Unity Profiler
In the Unity Profiler, Render Thread activity is primarily identified by markers prefixed with Gfx.. These markers are essential for understanding performance issues.
Gfx.WaitForCommands
This marker appears when the Render Thread is idle and waiting for the Main Thread to finish its work.
What this means in practice:
- The GPU is not the problem
- The Render Thread is ready
- The Main Thread is late in submitting rendering work
This is a strong indicator of a CPU-side bottleneck, usually caused by:
- Heavy scripting
- Physics cost
- Excessive draw call setup
- Poor batching
Camera.Render
Time spent in Camera.Render represents CPU-side rendering preparation, including:
- Culling
- Render pass setup
- Command buffer recording
- Scriptable Render Pipeline overhead
If Camera.Render dominates the frame and the GPU is underutilized, the application is likely CPU-bound due to rendering submission cost.
On its own, this marker does not prove a GPU issue or a CPU issue. Context matters.
Gfx.PresentFrame
When the Render Thread spends significant time in Gfx.PresentFrame, it means the frame is waiting for:
- The GPU to finish rendering
- Or display synchronization (VSync)
This typically indicates a GPU-bound scenario or a sync-limited frame.
Parallelism: How Unity Optimizes Render Thread Work
Unity provides features to reduce pressure on the Render Thread by increasing CPU parallelism.
Graphics Jobs
Graphics Jobs allow Unity to:
- Generate rendering commands across multiple CPU cores
- Offload work from the Render Thread to worker threads
Important clarification:
- The Render Thread still exists
- It coordinates and submits the final command stream
This helps most when rendering submission itself becomes expensive.
Split Graphics Jobs
Split Graphics Jobs further improve parallelism by:
- Reducing synchronization between the Main Thread and graphics worker threads
- Allowing rendering command generation to scale better with CPU cores
This mode shows the most benefit when:
- Draw call count is high
- Scenes are CPU-bound due to rendering submission
Low draw call scenes may see minimal gains.
Interaction Between the Main Thread and Render Thread
The Main Thread and Render Thread operate as a pipeline.
Two common scenarios appear in the Profiler:
- Render Thread waiting (
Gfx.WaitForCommands)
- Main Thread waiting (
Gfx.WaitForPresentOnGfxThread)
A useful mental model:
- The Main Thread prepares the work
- The Render Thread packages and submits it
- The GPU executes it
If either side stalls, the entire frame stalls.
Why This Matters for Optimization
If you do not understand the Render Thread:
- You will optimize shaders when the problem is scripts
- You will reduce textures when the bottleneck is draw calls
- You will misread profiler data and chase false problems
Correct interpretation of Render Thread behavior turns profiling from guesswork into an engineering process.


.png)
0 Comments