Developer Workflows, Profiling, IDE Tips, and Debugging Essentials
Unity 6 brings several improvements that make a developer’s life easier. From scripting workflows to profiling tools and debugging tricks, here’s a breakdown of practical things that actually help while developing.
1. Developer Workflows (Scripting)
Asynchronous Programming
Unity 6 introduces the Awaitable class, a lightweight, allocation-free alternative to coroutines. It supports async/await and integrates cleanly with Unity’s frame updates.
Inspector Enhancements
You can organize and control your scripts better using attributes. Remember, attributes allow special behavior if you put them above the variable,class or method. These are the metadata markers provide by unity and .NET:
[SerializeField]– expose private fields in the Inspector.[Range(min, max)]– show numeric variables as sliders.[Header]and[Space]– visually organize fields.[RequireComponent]– auto-add dependencies to avoid setup mistakes.[SelectionBase]– Select the main parent in a hierarchy instead of child objects.[Tooltip]– show helpful hints on hover.
UI Toolkit for Tools and Runtime UI
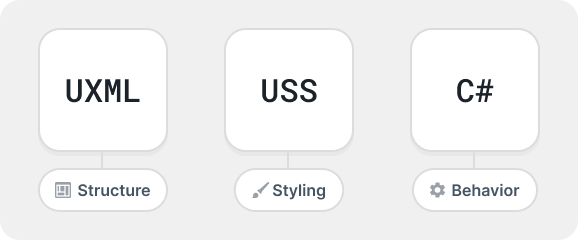
Use the UI Toolkit package to build custom windows, editors, tools, and even runtime UI for your game or team. It provides Global style management. There are some limitations of it, but before adopting the particular UI system, you must check the Unity UI (uGUI or Canvas-based UI ) vs UI Toolkit article.
 |
| UI toolkit architecture. Pic via Unity |
Custom Menus
Add frequently used functions directly to the Editor menu using [MenuItem]. It saves clicks and gives a personal touch to your project’s toolset.
Speeding Up Play Mode
Disable Domain Reload and/or Scene Reload in Project Settings > Editor to enter and exit Play Mode faster, especially when scripts or hierarchy won’t change.
Custom Script Templates
Create an Assets/ScriptTemplates folder to override default templates. Add namespaces, headers, or comments — whatever saves keystrokes and keeps structure consistent.
Data and Logic Separation
Use ScriptableObjects for static data like stats, sounds, or settings. Keeps logic and data cleanly separated, reduces duplication, and improves modularity.
Asset Distribution and Save Memory
Adopt Addressables early. Group assets by load frequency instead of type. It improves memory usage and reduces boot time by streaming content on demand.
Script Modularity
Organize code with Assembly Definition Files (.asmdef). Smaller assemblies mean faster compilation and more manageable dependencies.
Conditional Compilation
Define symbols in Player Settings > Scripting Define Symbols to control which code runs per platform or Unity version.
2. Profiling and Performance Tools
Memory Analysis
Use the Memory Profiler to find leaks, large allocations, or spikes. Always name resources created in code and release them properly.
 |
| Memory Profiler view - Pic via Unity |
Pinpoint Performance
Wrap heavy functions with ProfilerMarker to measure execution time precisely inside the CPU Profiler.
Project Audit
Run the Project Auditor (Unity 6.1+). It flags heavy scripting calls, unused assets, and performance issues, categorizing them as errors, warnings, or info.
Object Pooling
Re-use GameObjects instead of creating/destroying repeatedly. It prevents GC spikes and smooths frame rates.
Unclamped Interpolation
For motion or effects that overshoot, use Mathf.LerpUnclamped(a, b, t) instead of the clamped version.
3. IDE and Debugging Tips
Pause Execution
Insert Debug.Break() to halt execution at runtime and inspect object states, especially useful when manual pausing is tricky.
Assertions
Debug.Assert(condition, message) is a lightweight way to validate assumptions during runtime without cluttering builds with extra if checks.
Contextual Logging
Attach the source object to logs:
Debug.Log("Enemy spawned", gameObject)
Clicking the log highlights the object directly in the Hierarchy.
Rich Text in Logs
Use <b>, <i>, and <color> tags inside log messages to color-code or emphasize key info.
Stripping Logs from Builds
Wrap Debug.Log calls in [Conditional] methods and remove the symbol in Player Settings to exclude them from release builds automatically.
Visualize Physics
Use Debug.DrawLine and Debug.DrawRay to visualize raycasts and collisions for debugging gameplay physics.
Development Build Checks
Run diagnostics only in debug builds using Debug.isDebugBuild.
Optimize Stack Traces
Control which logs generate stack traces with Application.SetStackTraceLogType to reduce performance overhead.
Custom Logging
Use the Logger API for modular logging; useful for large projects where subsystems need separate channels or formats.
Console Readability
Adjust Console settings to show more lines per log entry for better clarity.
Visual Studio Code Shortcuts
Memorize essential shortcuts, faster navigation and refactoring directly reflect in productivity.
Final Thoughts
Unity 6 improves everyday workflows quietly but significantly. The key is to adopt small, consistent habits, structured scripting, organized profiling, and a clean debugging setup. Over time, these stack up to major productivity gains.


.png)
0 Comments